Visual management with Aquiweb
Visual management is a tool that integrates into a global approach of continuous improvement and performance management. Its objective is to define, using visual tools, a better working environment. The basic principle of visual management is the provision of information useful for operators but also for managers. This information must be concise and made available at the right time. The goal is to inform in real time to make good decisions.
Visual management for what purpose?
Visual management has many applications. In industry, the aim is to create a working environment with the following qualities:
- Be as close as possible to the operator.
- Facilitate responsiveness and therefore be an aid to decision-making.
- Facilitate and simplify the definition of objectives.
The board is set up, containing easily understandable numerical and graphical data (curves). It must be easily accessible by all. It is the communication medium for all (operators, directions, visitors) and dialogue for the actors of production.
Il permet de développer l’esprit d’équipe en affichant les objectifs au poste, à la journée et la contribution de chacun.
FLASH Board to digital display
Flash board contains the most representative information that allows a quick synthesis of the production. Each information must be in its place according to:
- Periodicity (days, week)
- The machine or aera zone
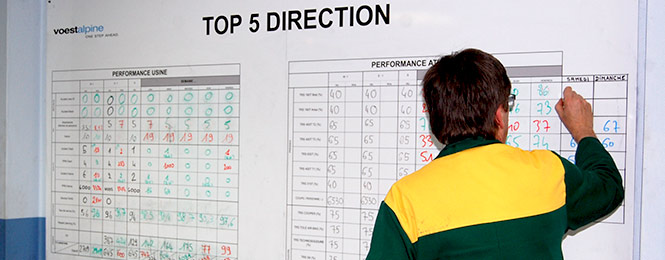
Frequently Asked Questions :
- daily data board
- 4 to 5 performance indicator
- A summary of the results
- A communication link between the different teams
- Monitoring productivity of production
- Graphical display of the production target to the team, the day
- Monitoring productivity against target:
- Green = ok
- Red = Wrong
- Correlation with the causes of change in production
- Les actions de la semaine
But updating these data is tedious. Collecting, verifying their accuracy, compiling them, calculating the indicators, and reporting the results on the board.
Implementation
Start your visual management
- Which informations ?
- Wich persons ?
- Wich aera ?
- Where, how ?
Data processing
It collects, centralizes and processes information. Mes software facilitate agregation
- Automatic or manual data collection from multiple sources :
- Data centralization for real-time access and ensuring consistency.
- The processing of data for an aggregation of the information (the raw data becomes an analyzable datum).
Communication
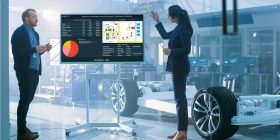
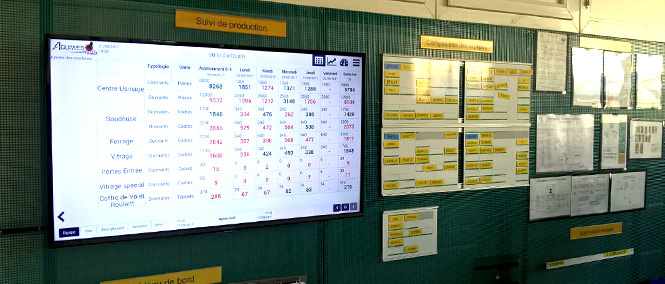
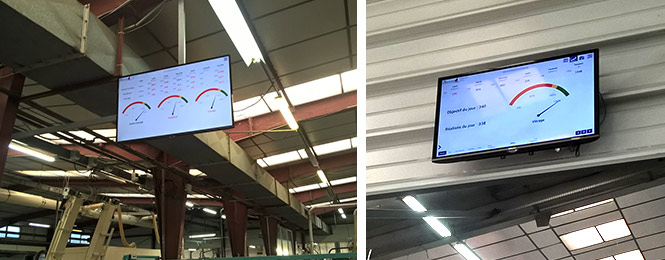
After processing and aggregation, these data will have a real added value and can be dynamically disseminated on digital media (screens, tablets and smartphones). These supports replace or supplement the FLASH table.
Of course, the advantage of using the MES software makes it easy and without delay to have digital, graphic or visual indicators in real time. Wherever traditional media are used, the frequency of updating will be rather early or weekend or early in the day (for example, tables and curves inserted in transparent sleeves)
Mes AquiWEB solution MES and visual management
The deployment of the MES AquiWEB software in a workshop makes it possible to collect useful information related, in particular, to the performance of the actors in the production. It can also guide the operator in his activities: control of operating modes or simple display of specific documentation.
Une aide motivante pour les opérateurs
Stéphane Delort, factory manager AMCC : « Les écrans apportent de la modernité dans l’atelier et créent une dynamique de travail grâce à l’information diffusée en temps réel ».
Jean Michel Jacquet, production manager Plumettaz : « Les opérateurs aiment voir du vert, ils apprécient que leurs machines soient performantes ».
Patrice Millot, production manager Affinity Petcare : « Pour l’auto-maintenance, les procédures sont affichées sur écran pour le guidage des opérateurs ».
Visual management seen by managers
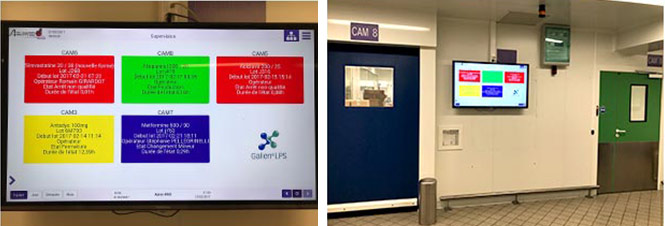
Madjid Meziani, production manager Galien LPS : « Si une machine reste trop longtemps à l’arrêt, je le sais tout de suite. Cela me permet de relancer la technique ».
The company Galien LPS de Sens, supplies pharmaceutical products. As a safety measure, access to packaging lines is restricted to authorized personnel only. In the corridor a large screen allows to visualize the condition of the productions of the packaging lines.
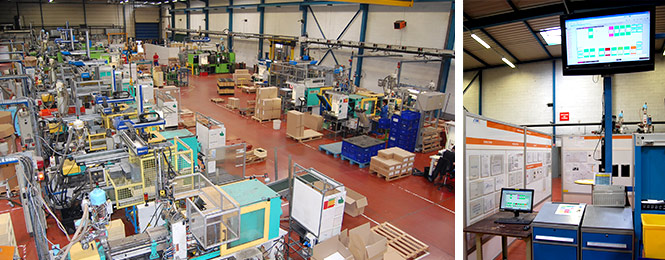
Sébastien Philippe, production manager CGR Bedeville : « Dans notre atelier, des machines pouvait-être à l’arrêt 10h d’affilées sans que personne ne le sache. Toutes reliées à AquiWEB, l’état fonctionnement est immédiatement visible depuis un grand écran positionné au cœur de notre d’espace réunion ».
Alain Clarard, production manager Marcel Cartier : « depuis mon bureau, j’ai, en une seule vue, l’état des machines de production ».